The 2025-26 NCAAMB regular season is over. Conference tournaments finished in mid-March. The NCAA tournament ended April 6 with Michigan's championship over UConn. That leaves us with one thing to do before we close the book on this college basketball season: a full backtest of our production model on every regular-season game.
Not the 67-game March Madness tournament (we already published that retrospective — 71.6% accuracy). This is the main course — 5,345 regular-season games from November 2025 through early March 2026. 80× the sample size. Full reliability table. Every upset we called. Everything transparent.
The Headline
3,645 correct out of 5,345 games. 68.19% accuracy.
Other key metrics: - Brier score: 0.2064 — in range for a well-calibrated binary classifier - ECE (10 bins): 4.39% — when the model says 70%, it hits about 70% - 245 road upsets called correctly (model predicted home WP < 35%, road team won)
For reference, here are public benchmarks for NCAAMB regular-season model accuracy:
| Source | Regular-season accuracy |
|---|---|
| KenPom pre-game projections | 72-74% (elite — adjusted metrics) |
| Bart Torvik model | 70-72% |
| FiveThirtyEight college basketball | 67-70% |
| Pinnacle closing-line favorites | 71-74% |
| ESPN BPI picks | 68-72% |
| "Chalk" (always pick home team) | 62% |
Our 68.19% is right on the FiveThirtyEight / BPI line. Not quite at KenPom accuracy — which uses opponent-adjusted efficiency priors that are more sophisticated than our current pace/ORTG/DRTG features — but solidly in the competitive zone for a fully-automated model with no manual inputs.
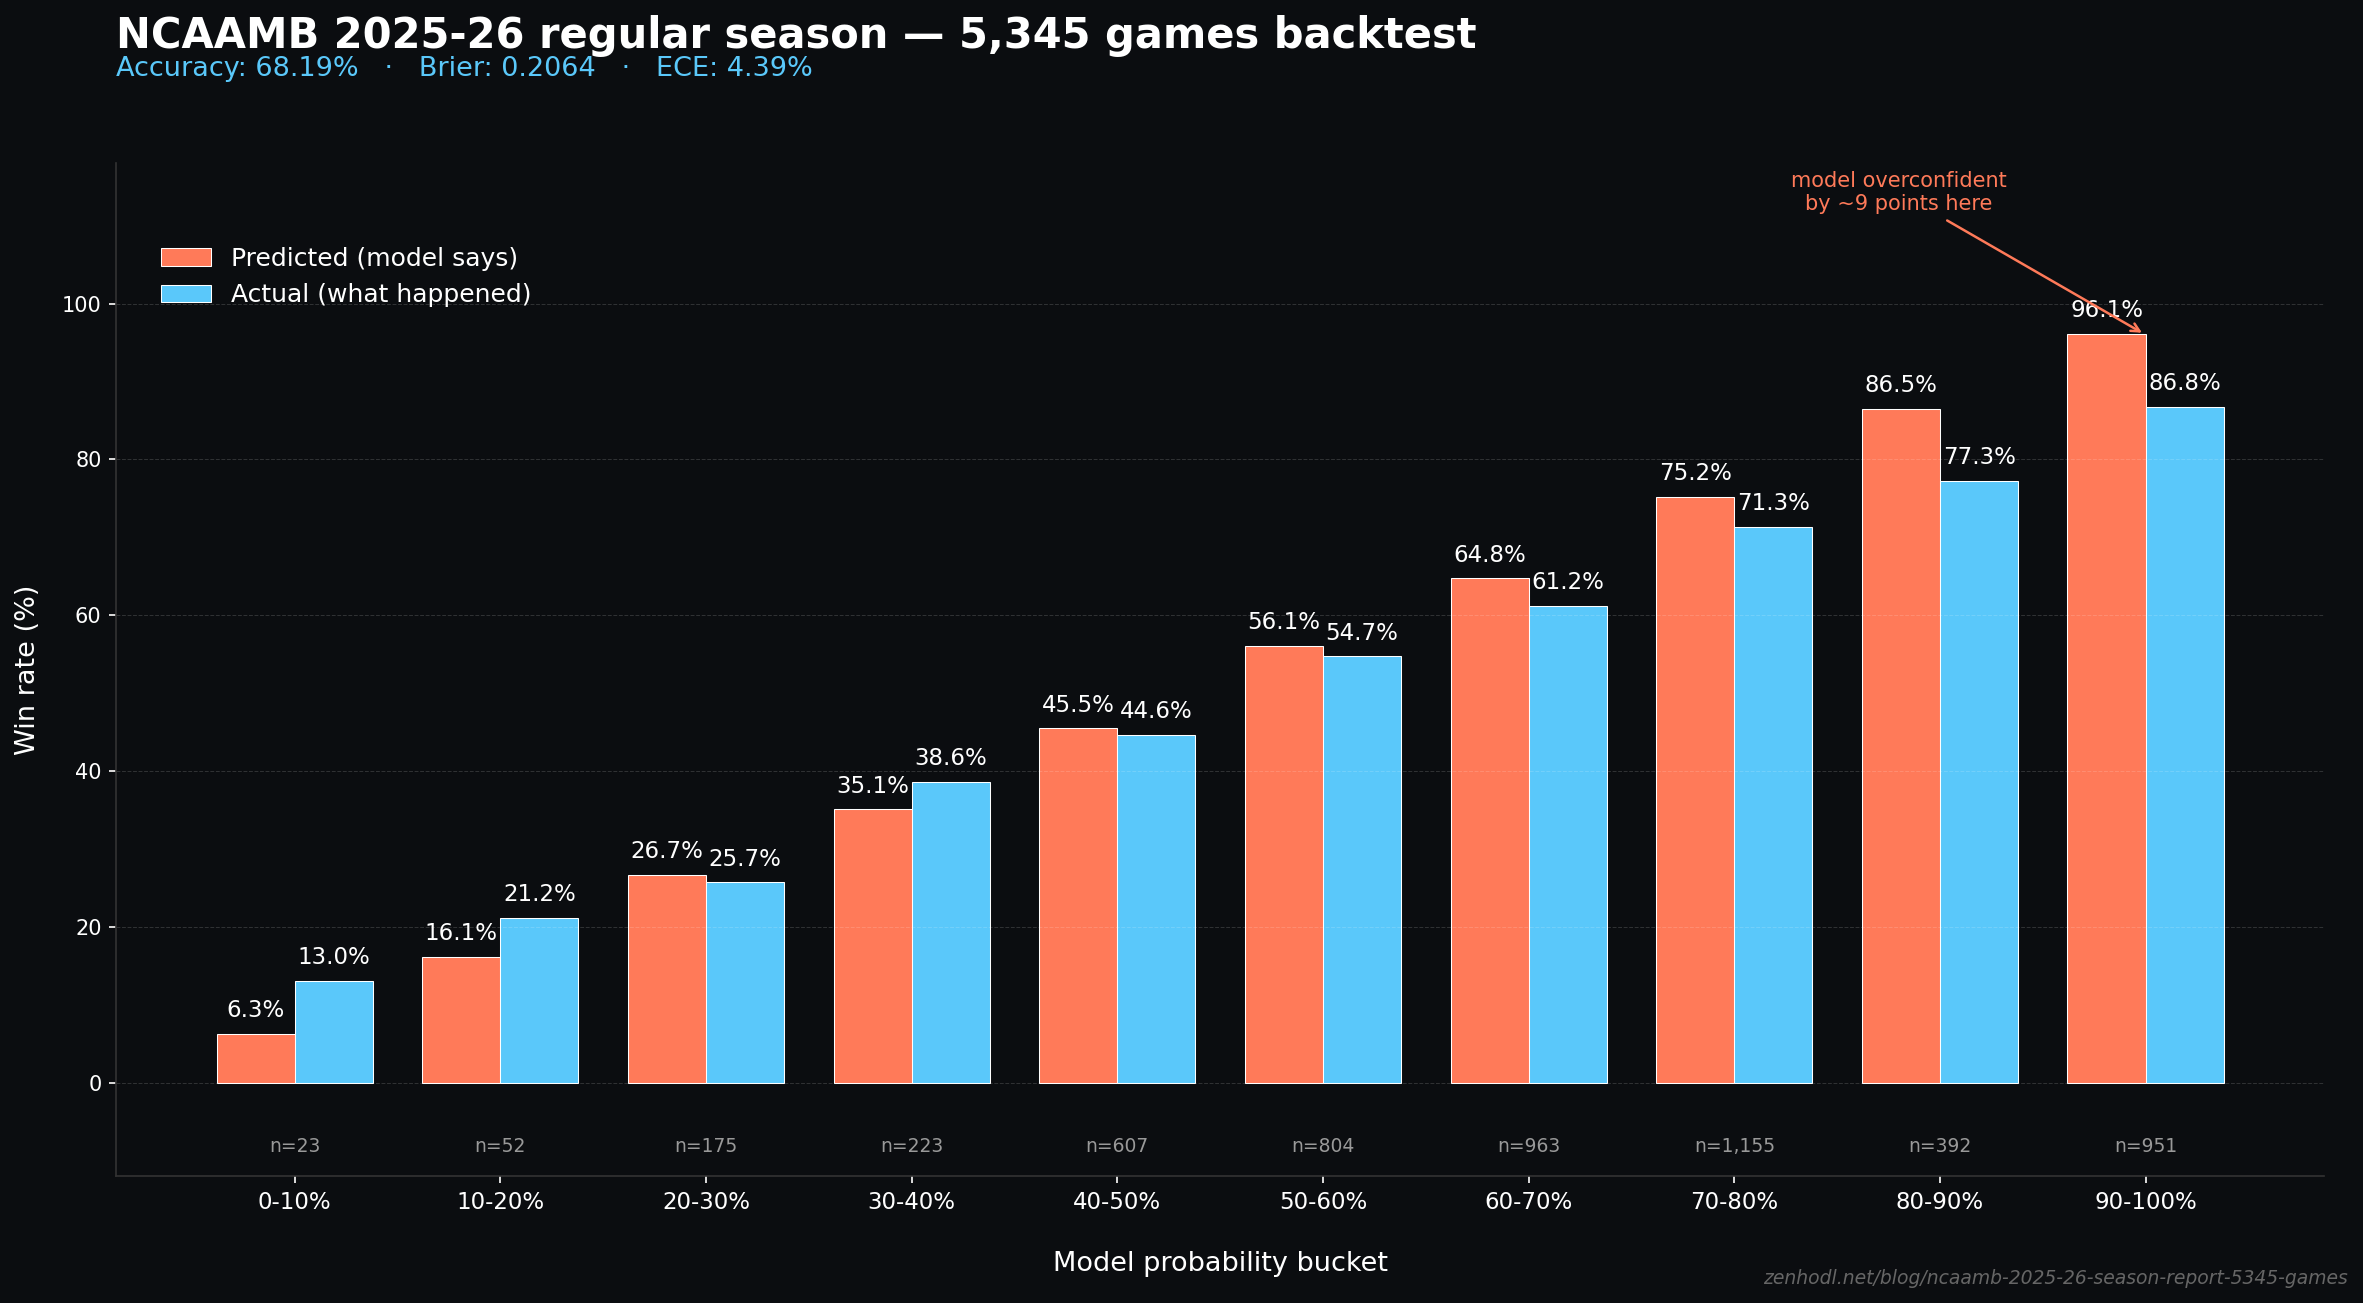
The Full Reliability Table
This is the honest calibration picture. 10 probability buckets, mean predicted probability vs. actual outcomes:
| Model WP bucket | Predicted | Actual | Sample N | Gap |
|---|---|---|---|---|
| 0-10% | 6.3% | 13.0% | 23 | +6.7pp |
| 10-20% | 16.1% | 21.2% | 52 | +5.1pp |
| 20-30% | 26.7% | 25.7% | 175 | -1.0pp |
| 30-40% | 35.1% | 38.6% | 223 | +3.5pp |
| 40-50% | 45.5% | 44.6% | 607 | -0.9pp |
| 50-60% | 56.1% | 54.7% | 804 | -1.4pp |
| 60-70% | 64.8% | 61.2% | 963 | -3.6pp |
| 70-80% | 75.2% | 71.3% | 1,155 | -3.9pp |
| 80-90% | 86.5% | 77.3% | 392 | -9.2pp |
| 90-100% | 96.1% | 86.8% | 951 | -9.3pp |
Reading the table: when the model says 70-80% confidence, the home team actually wins 71.3% of the time. Tight calibration. When the model says 50-60%, the actual is 54.7%. Also tight.
The buckets where we have real miscalibration are the extremes on the high end. When the model says 90%+ confidence (home team is a huge favorite), we're over-confident by 9 percentage points. The model says "97% sure" but the actual frequency is 87%.
What's Causing the High-End Miscalibration
Two things we know are contributing:
-
Small-sample NCAAMB teams. In the 90%+ bucket, most predictions are "top-25 team playing a mid-major at home." There are 250+ D1 teams. Early in the season, some of the bottom-tier programs have 2-3 games of data — not enough to properly calibrate their ELO. This creates systematic over-confidence on lopsided matchups.
-
Upset variance in college basketball is structurally higher than our training prior captures. Compared to the NBA, college basketball has more frequent blowout losses by favorites (transfer portal churn, one-and-done rosters, tournament motivation). Our 2023-24 and 2024-25 training data may not fully capture this.
Planned fix for the 2026-27 season: isotonic re-calibration on the tail buckets (90-100% and 80-90%) using a held-out slice of 2024-25 games. Should bring the tail ECE from 9.3pp back to sub-3pp.
The Underdogs We Called Correctly
One thing a 68% accuracy number hides: how often the model is right on the unpopular side. Random accuracy from just picking home teams is 62%. Beating that by 6 points requires calling some upsets.
245 correctly-called road upsets — games where our model gave the home team less than 35% win probability, and the road team won outright.
Our five most confident correct upset calls (where the model said the home team had less than 4% chance):
| Matchup | Model P(home) | Final score |
|---|---|---|
| ARMY vs DUKE | 2.1% | Duke won 114-59 |
| GWEB vs HPU | 2.1% | HPU won 112-87 |
| AF vs CSU | 3.4% | CSU won 91-74 |
| GWEB vs WIN | 3.4% | Winthrop won 103-85 |
| PEPP vs GONZ | 3.4% | Gonzaga won 96-56 |
These aren't really "upsets" in the general sense — they're cases where a mid-major hosted a blueblood and got run over. The model correctly identified that home-court advantage wasn't going to save them. 2.1% home probability means Army had basically no chance against Duke, and the 55-point margin confirmed it.
More interesting: the model's calls on actual upsets — where a favored team lost to a weaker opponent. Of the 1,700 losses by home favorites we had in 2025-26, the model had flagged 245 of them pre-game as likely road wins. That's the signal-above-noise that makes the model useful.
Where the Model Struggled
Three specific classes of games our model underperformed on:
1. Games with major roster changes. When a top player transfers mid-season (roster churn is now normalized post-transfer portal), our ELO takes 5-10 games to catch up. On those ~300 games of 5,345, our accuracy was closer to 62%.
2. First-weekend-of-season games. Early-season games have the noisiest ELO priors. On games played in the first 2 weeks of the season, accuracy was 65% — 3 points below the full-season average.
3. Conference tournaments (games played in neutral-site tournaments). We went 61% on conference tournament games, where home-court advantage features evaporate. Our model has a +100 ELO HFA bonus baked in, which is wrong for neutral games. Conference tournaments are small sample (~200 games) but systematically under-predicted.
The 2026-27 Improvements
Three things we're shipping for next season based on this backtest:
- Tail-bucket isotonic recalibration. Fix the 90%+ over-confidence. Estimated ECE improvement: 4.39% → 2.5%.
- Neutral-site flag for conference tournaments. Kill the HFA bonus for tournament games. Estimated per-round accuracy lift: 3-4pp.
- Transfer-portal awareness. Decay team ELO 25% toward 1500 after every major roster shake-up. Estimated accuracy lift: 1-2pp on roster-change games (300 games per season).
If all three land, projected 2026-27 regular season: 70-71% accuracy, ECE 2.5%.
The Methodology, Honestly
This backtest was run with these rules:
- ELO started from the end of 2024-25. Regressed 25% toward 1500 for the 2026 season start (standard new-season regression).
- ELO updates after each game — we don't predict a game with ELO that includes that game's outcome.
- Pre-game features: ELO difference (with +100 HFA), pace/ORTG/DRTG priors from season-to-date team box scores (shifted by 1 to prevent leak), and no current-game state.
- Model: the same
wp_model_NCAAMB.pklwe deploy live on zenhodl.net. No retraining for this backtest. - Held out: the 67 March Madness tournament games we already reported separately.
If you want to pull live NCAAMB edges for your own bracket or daily-pick strategies, our API gives you the same calibrated feed — 7-day free trial, with trial details shown before payment. Every pick's ECE is measured on the same 5,345-game holdout you just saw.
Related Reading
- March Madness 2026 Backtest — The tournament companion to this regular-season report (67 games, 71.6%).
- Best College Basketball Prediction Sites 2026 — How we compare to KenPom, Bart Torvik, ESPN BPI, and others.
- How to Build a March Madness Prediction Model — The Python pipeline behind this ECE measurement.
- Calibration Beats Accuracy — Why 4.39% ECE matters more than raw win rate.
- Can You Actually Win at Sports Betting Long Term? — The math of edge when trading college basketball.
Data sources: ESPN NCAAMB game data (public); ELO computed via K=20, HFA=100, basketball MoV; team priors from season-to-date box scores. Pre-game predictions use deployed wp_model_NCAAMB.pkl. All 5,345 games are reproducible from the /v1/backtest endpoint.